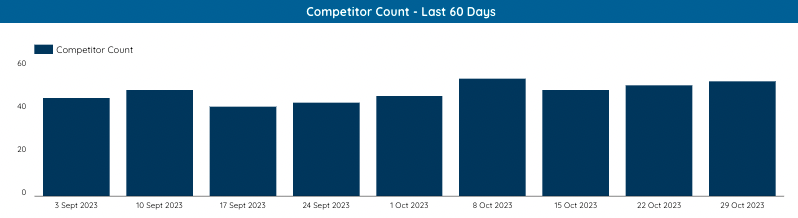
You can use the existing API endpoints to create custom visuals, like a Competitor Count Chart, which you can easily add to your dashboard in just a few steps.
Data sources required
One data source is required - the Market Trends Share of Clicks API endpoint, or the Share of Impressions API endpoint. The key difference is that Share of Impressions will surface more competitors, as it includes competitors who received impressions but not clicks.
Implementation
1. Connect your data source:
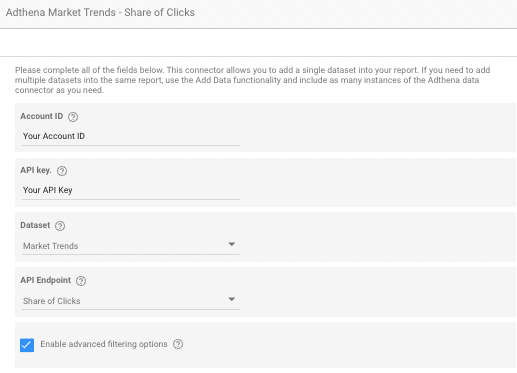
Configure your settings as shown above before moving on to the remaining settings:
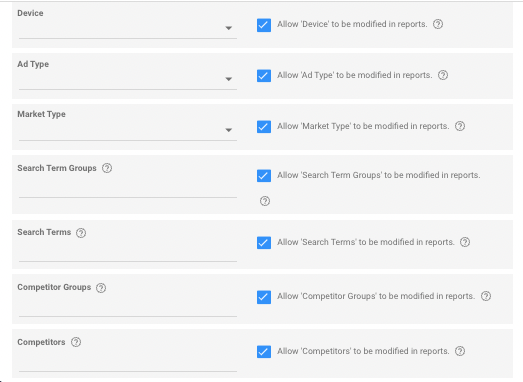
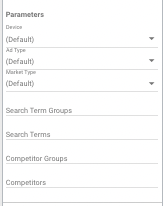
Here, you can decide if you want to filter the data by specific devices, ad types, or groups - or you can leave this blank and tick the checkbox to allow for further filtering later.
2. Create your chart - this can be a line chart, or a bar chart like ours. You'll need the below dimensions and metrics:
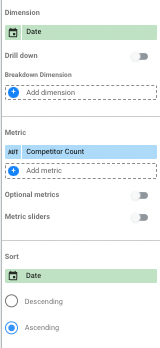
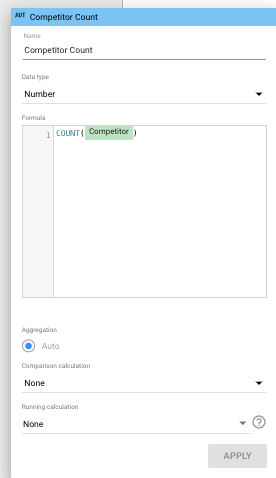
Competitor Count is a calculated field, set up as below:
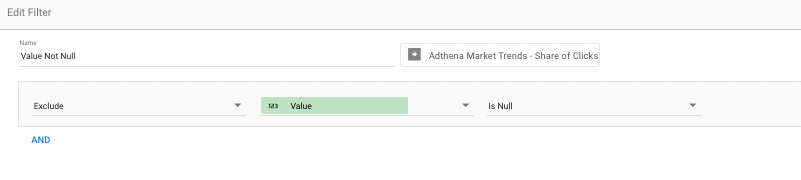
3. Finally, we need to apply a filter on our chart:
Done! You can now further edit your chart using different date ranges, or parameters:
Comments
0 comments
Please sign in to leave a comment.