You can blend Adthena data with Google Ads data to overlay metrics together in tables or graphs - in this example, we will blend the data to visualise Adthena's Market Share vs Avg. CPC from Google Ads:
Data Sources
Two data sources are required:
- Google Ads
- Adthena Market Trends - Share of Clicks OR Adthena Segmented Market Trends - Share of Clicks
If you're planning to view multiple categories, using the Segmented Market Trends endpoint will be faster to set up.
Implementation
*the same logic applies for other Google and Adthena metrics - you can overlay Share of Impressions with Avg. CPC, Market Share with ROAS, or any other combination
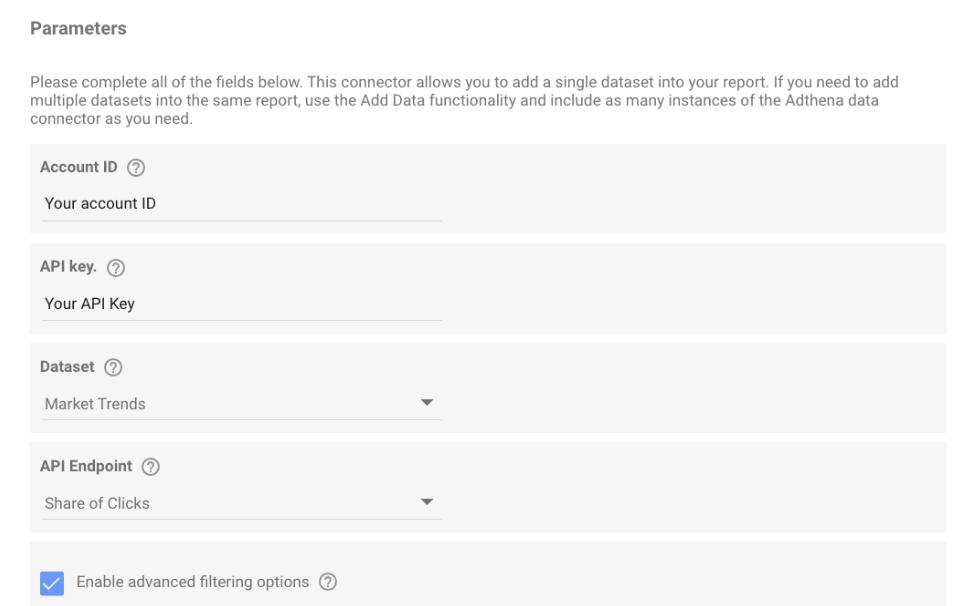
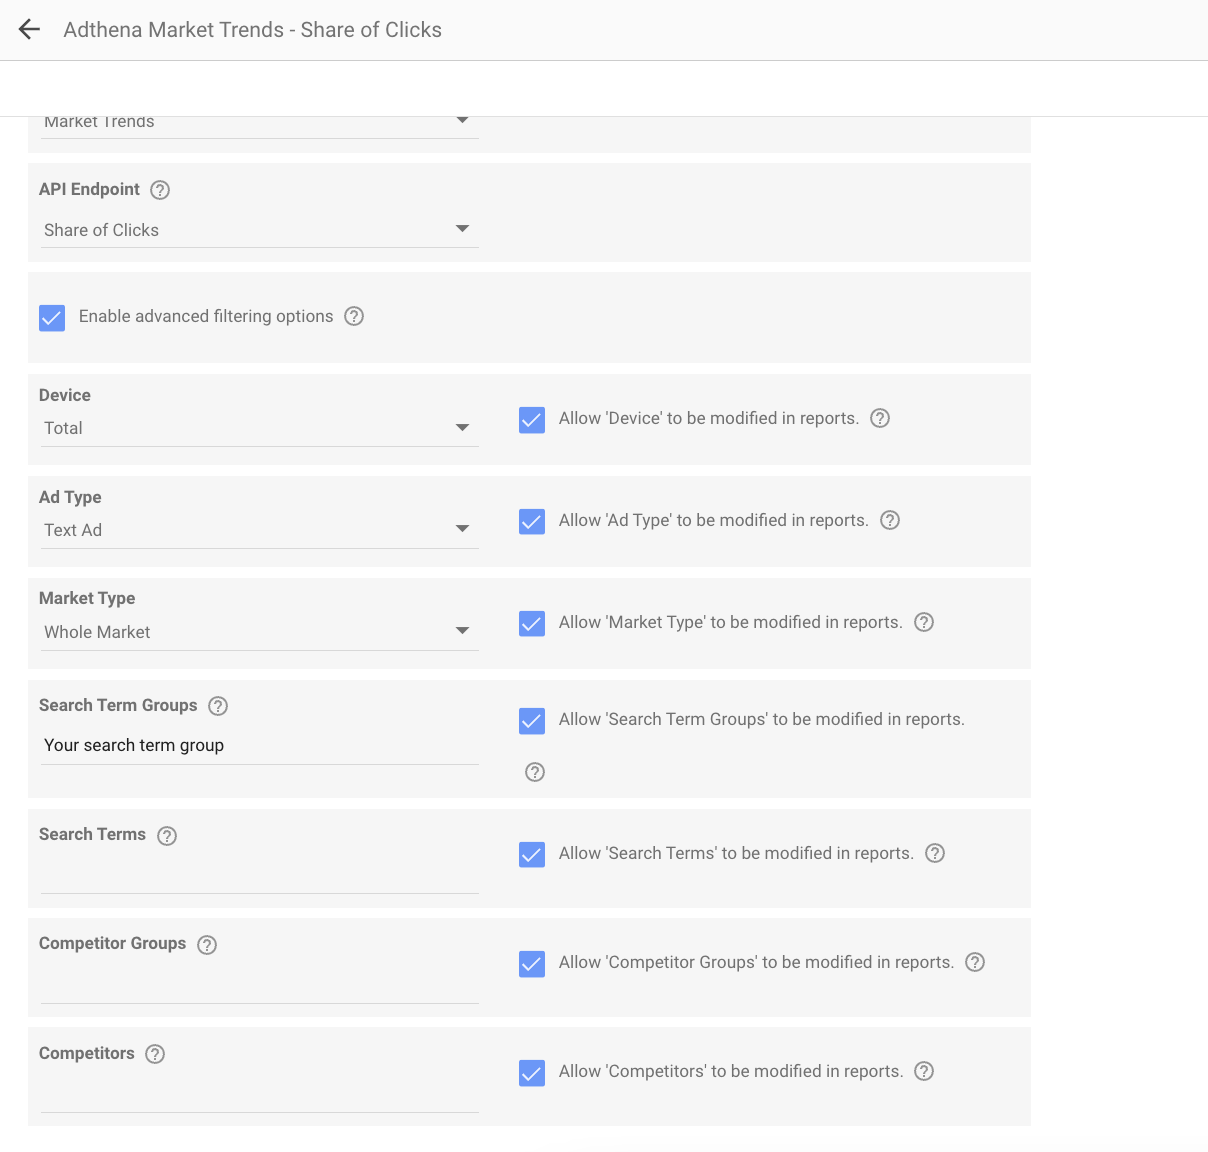
- Connect your data sources. for Adthena, pre-filter the data source in the parameter to just the search term group you want to view if you're using the regular Market Trends endpoint (unless you want to see top-level market share across all of your activity), or include all the groups you'll want to breakdown the data for if you're using the Segmented Market Trends endpoint. You can also select a specific channel only if relevant (as we’re looking at avg. CPC, we’ll select just text ads):
- Blend your data sources together:
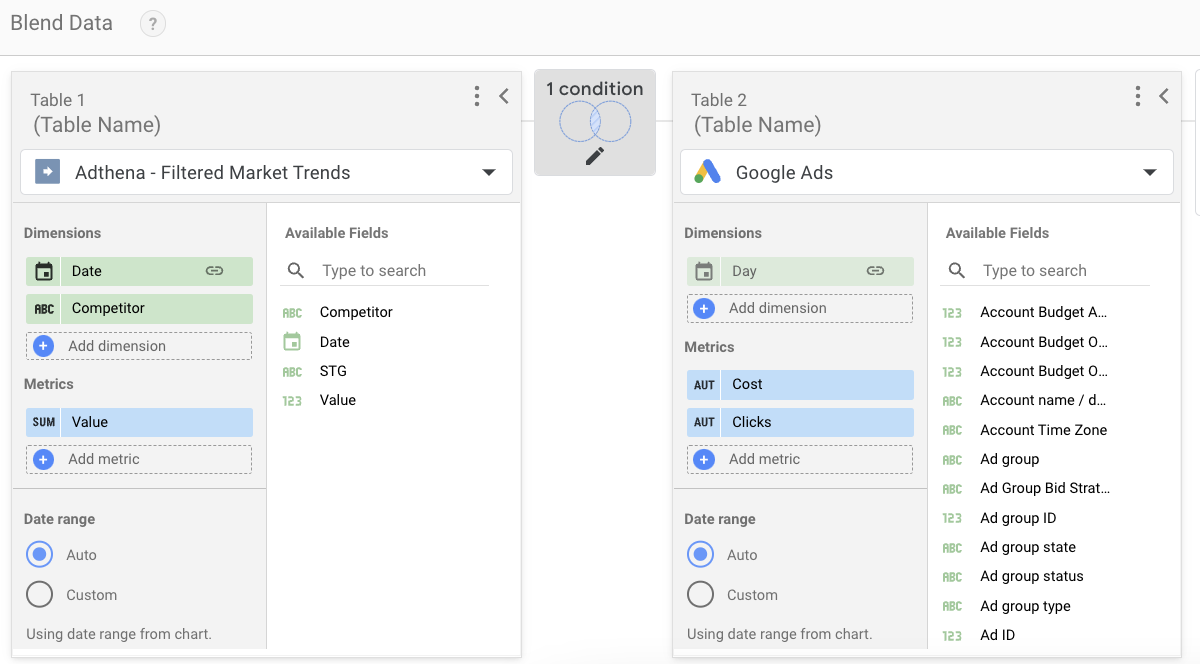
You can select whichever metrics you want from Google Ads, in this case, we’re taking cost and clicks so we can calculate avg. CPC. In the Adthena data, the value will equal whichever API value was selected, in this case, the Share of Clicks (Market Share).
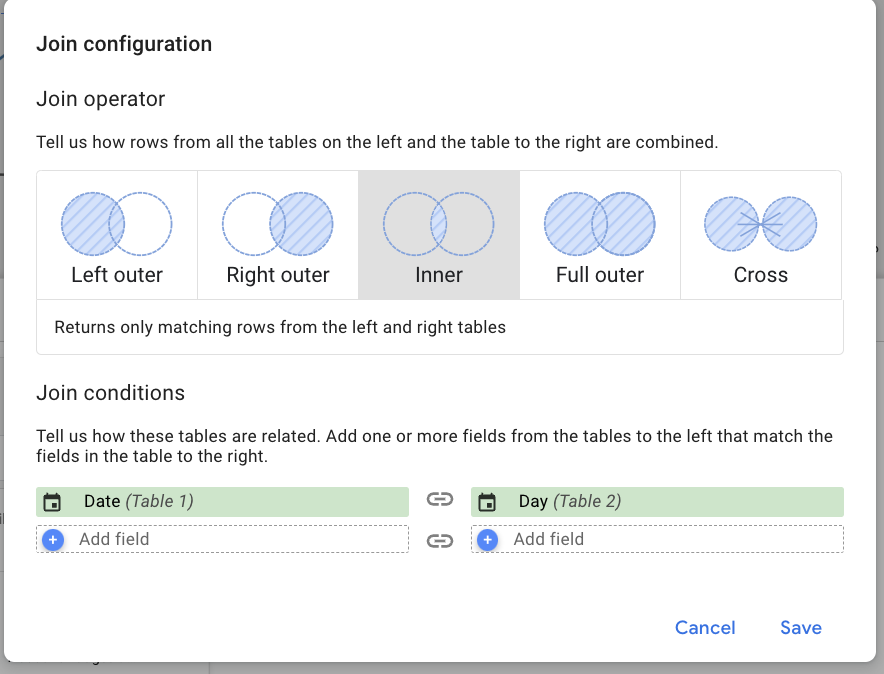
We connect the data using Date/Day as the join key, and an inner join:
Finally, we apply a competitor filter to Adthena data, and a campaign filter to the Google Ads data:
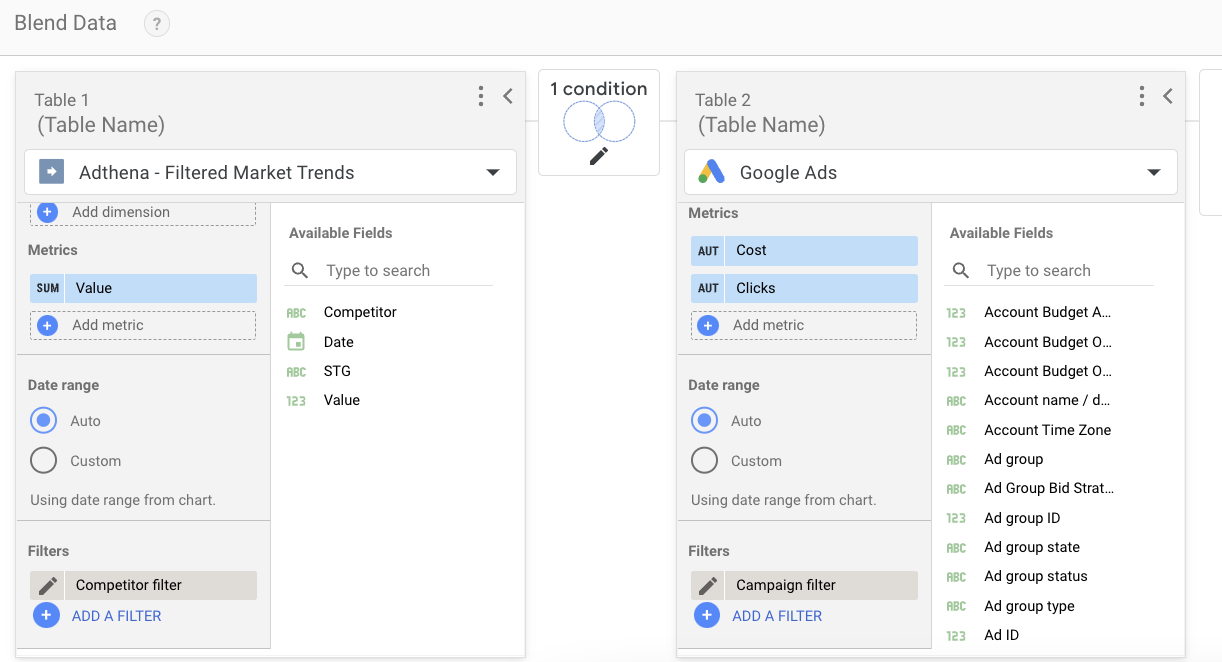
Competitor filter: we just want to filter for our own domain to pull in data for our market share vs avg. CPC, as we’ll be putting together a combo chart.
Campaign filter: if you want to compare a specific Adthena search term group vs an equivalent Google Ads campaign/category, applying a campaign filter here and pre-filtering the Adthena data in the parameters as we did previously will ensure we’re comparing the relevant groupings only. You can leave both unfiltered, in which case you will see market share and avg. CPC for all of your activity at a top level instead.
If you selected the Segmented Market Trends endpoint, you will also need to include the Search Term Group filter at this stage for the Adthena data - filtering for the search term group equivalent to whichever campaign from Google Ads you selected.
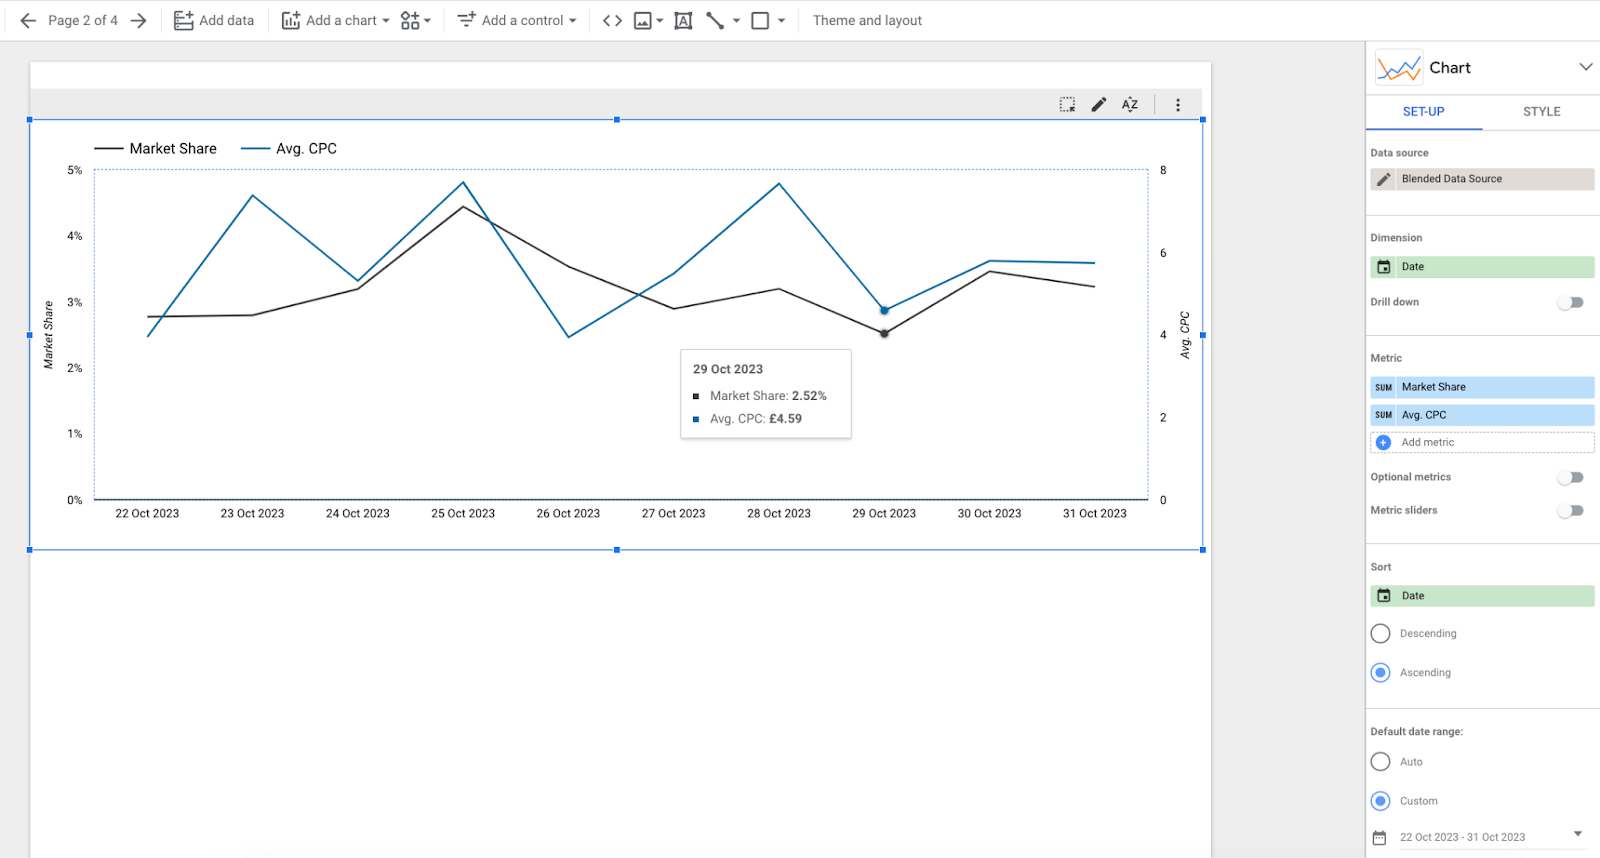
- Now, we can create a combo chart using our blended data source, to see our Adthena market share vs Google Ads avg. CPC over time:
If you’re breaking down performance by category, you’ll need to repeat this process as many times as you want to have the data broken down, for example, 5 times if you want to see 5 categories. You can re-use the same Google Ads data source in each blend, but you’ll have to re-connect the Adthena data source each time, to be able to pre-filter it to a specific group.
If you use the Segmented Market Trends API endpoint instead, you can re-use the Adthena dataset in each blend too and just filter for the relevant group as you would for the campaign in Google Ads.
Comments
0 comments
Please sign in to leave a comment.